
Getting Started
Background
The Juniper National Dataset was announced in Autumn 2019 when we created out first datapoint. Taking data from across our pupil tracking products we were able to use teacher assessment judgements to create a comprehensive national picture of attainment in Key Stages 1 and 2. With data from over 6000 schools and almost 1.5 million pupils the Juniper National Dataset gives us a nationally representative dataset for analysis.
Read the original announcement and updates: junipereducation.org/national-pupil-dataset.
At the time of writing (May 2024) the dataset now includes:
- Autumn 2019
- Autumn 2020
- Summer 2021
- Autumn 2021
- Spring 2022
- Summer 2022
- Autumn 2022
- Spring 2023
- Summer 2023
- Autumn 2023
- Spring 2024
- Summer 2024
The Juniper National Dataset has also been used to produce a well-recieved report which examines how the pandemic has impacted on the attainment of primary school pupils. The report attracted national press, TV and academic interest. We are now working with Ofqual on future plans.
Read the press release: junipereducation.org/youngest-pupils-learning-worst-affected-by-covid-19-pandemic-new-report-reveals.
Read the report: junipereducation.org/national-dataset-report.
The Data
Before you begin it is worth just looking at where the data has come from and the basis of the calcuations.
With unparalleled numbers of assessments entered using one of our pupil trackers, we collect Key Stage 1 and 2 assessments from OTrack, Target Tracker, Classroom Monitor and Pupil Asset. Of course all the data is anonymous, but we know who receives pupil premium, is SEN, etc. so we can look at contextual groups.
Regardless of the source of the data we can judge whether pupils are:
- Working below age related expectations (ARE)
- Working at ARE
- Working above ARE
Using the Analysis Tool
Enter data using 'Your Data', see the analysis on 'Your Dashboard' and manage saving and retrieving your data on 'Retain/Retrieve/Manage'.
This short video guides you through the main features and each of the options is also explained below.
Your Data
Use this screen to enter your data for analysis:
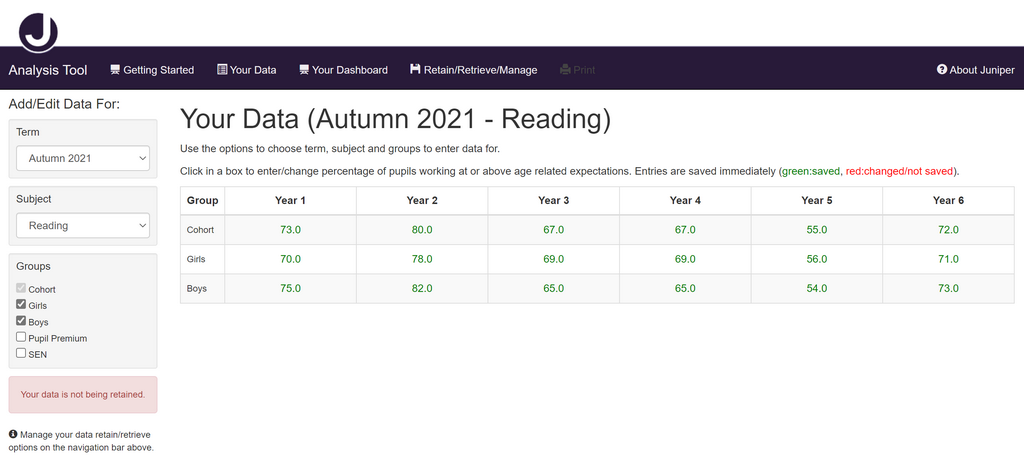
Choose the term, subject and groups from the left-hand side.
Click in a cell in the table to enter your data which will be saved as you go along. You can navigate between cells quickly by clicking the 'tab' key on your keyboard.
Note that by default your data is not retained, you can choose to save your anonymous data so you can return to it and, for instance add in further terms - see below for more information.
Your Dashboard
This screen analyises your data - providing a comparison between your entered data and the Juniper National Benchmark:
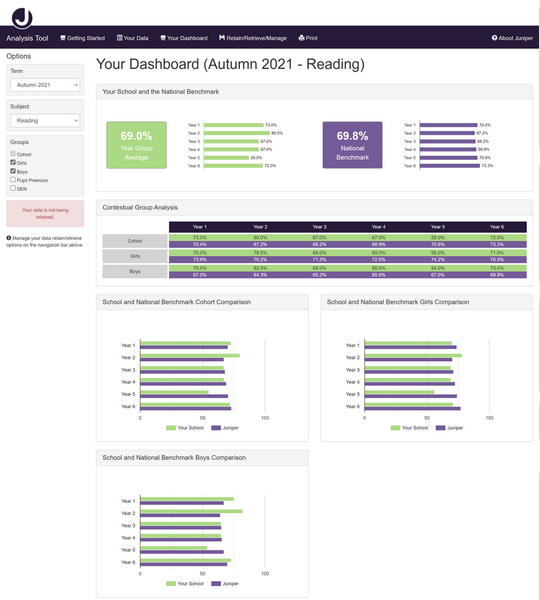
As before choose the term, subject and groups from the left-hand side.
The analysis can be printed by clicking the 'Print' on the menu bar - a printable version of the screen will appear in a new tab or window.
Retain/Retrieve/Manage Your Data
The system does not store any data which allows your school to be identified, it only stores the percentages you enter. This data is deleted (within 24 hours) unless you wish to retain it.
If you opt to retain your data you can retrieve it at a later date, for instance when a new Benchmark datapoint is available, and build on your existing dataset.
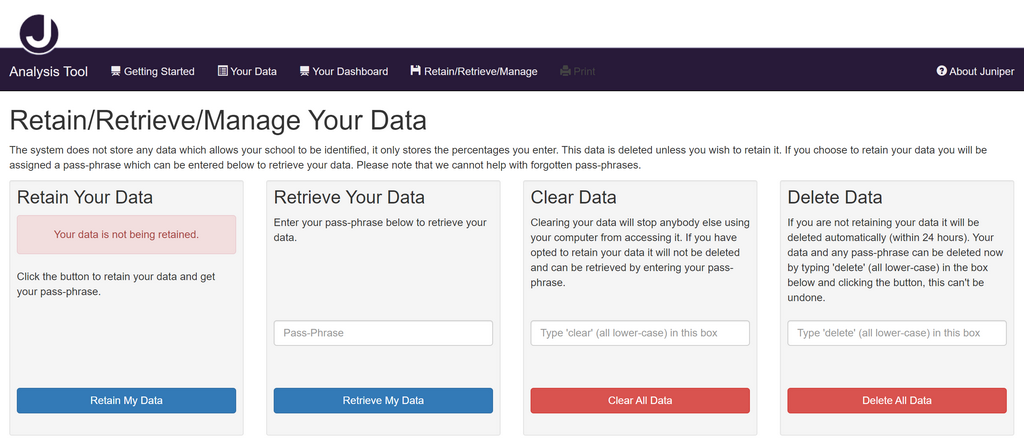
To save your data click 'Retain My Data', you will then be given a passphrase (e.g. 'unwoven-eligibly-radial'). This passphrase is the only way to retrieve your data (note that at no point are you prompted for the name of your school or any other details). Please note we cannot help with forgotten passphrases.
To retrieve your data enter your passphrase and click 'Retrieve My Data'.
To clear your data (but not delete it if you have chosen to retain it), type 'clear' in the box to confirm and then click 'Clear All Data'.
To permanently delete your data and passphrase (if it has been retained), type 'delete' in the box to confirm and then click 'Delete All Data'.
We cannot help retrieve data which has been cleared or deleted.